5. Change what data is displayed
This section of the documentation explains how to edit the metabolite and isotopologue data that appears on the Escher Map.
5.1 Metabolites to Display
Escher-Trace allows users to select to only display data from a subset of metabolites. Below, is a walkthrough of how this is done.
5.1.0 Make the Metabolites to Display Pop-up Appear
Click Metabolites to Display to make the selection appear.
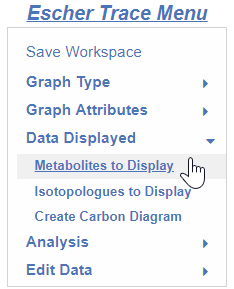
After click:
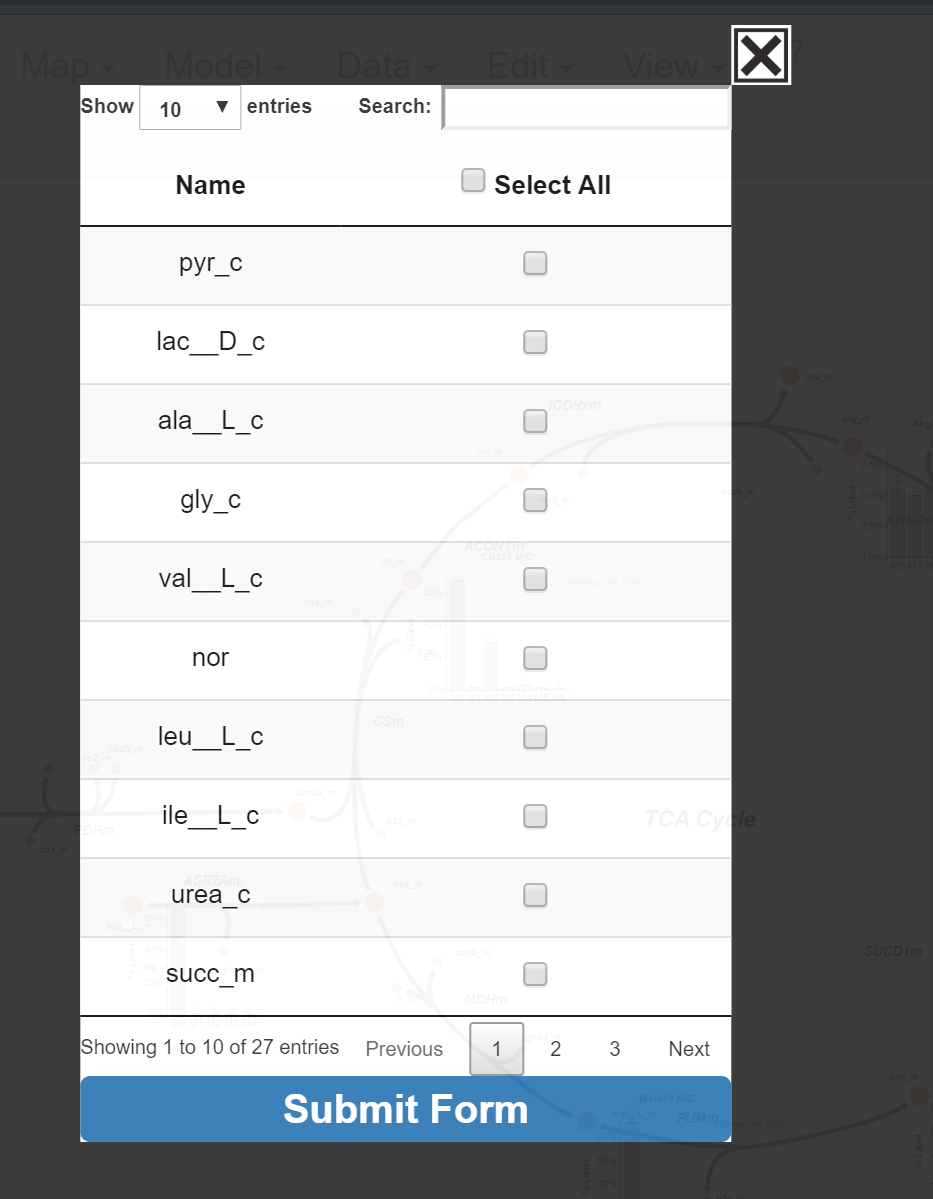
After the Metabolite to Display pop-up appears, the user may begin selecting metabolites whose data they would like to have displayed on the Escher Map.
5.1.1 Metabolite Selection Table Functionality
Many Escher-Trace pop-ups include tables. Below is a walkthrough of interacting with the Metabolite Selection table, but much of it is applicable to all Escher-Trace pop-up tables.
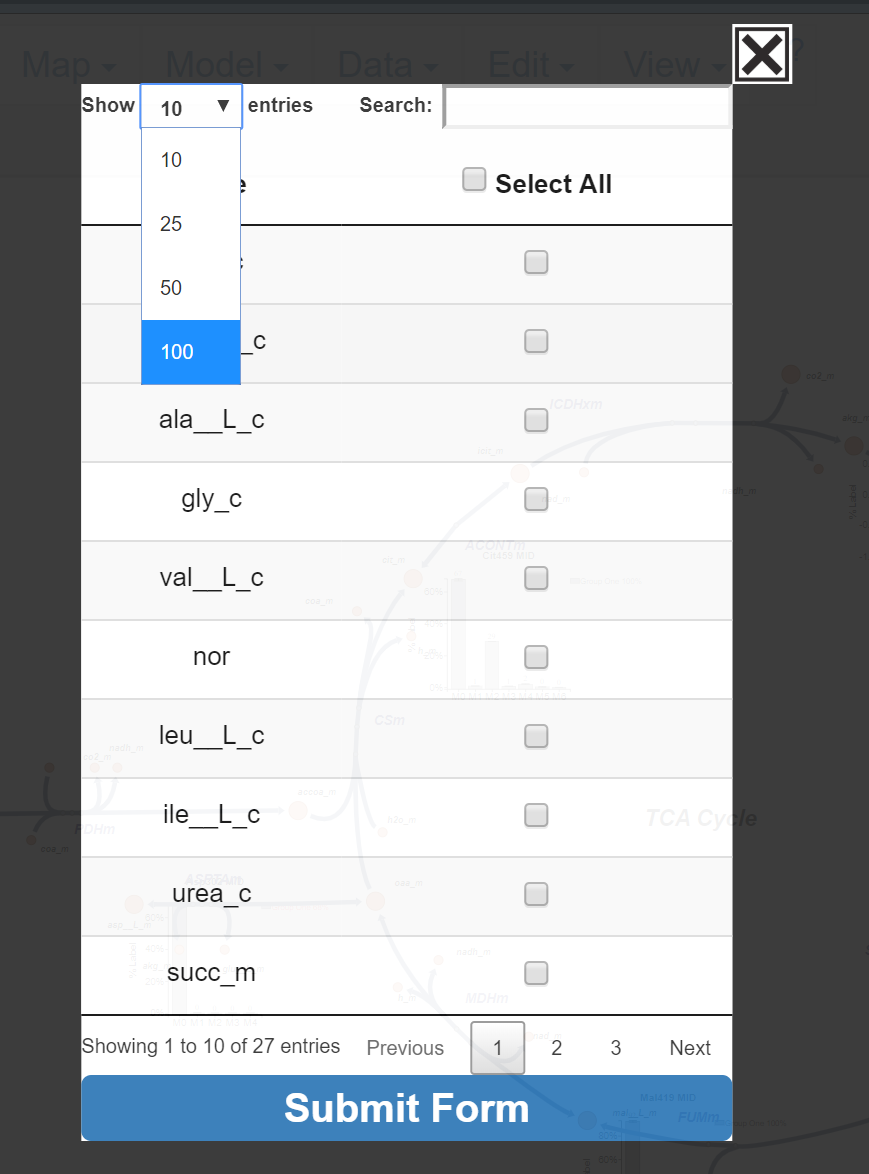
5.1.1.1 Entries Displayed
Change the number of entries displayed in the pop-up by clicking on the drop down menu in the top left and selecting a number.
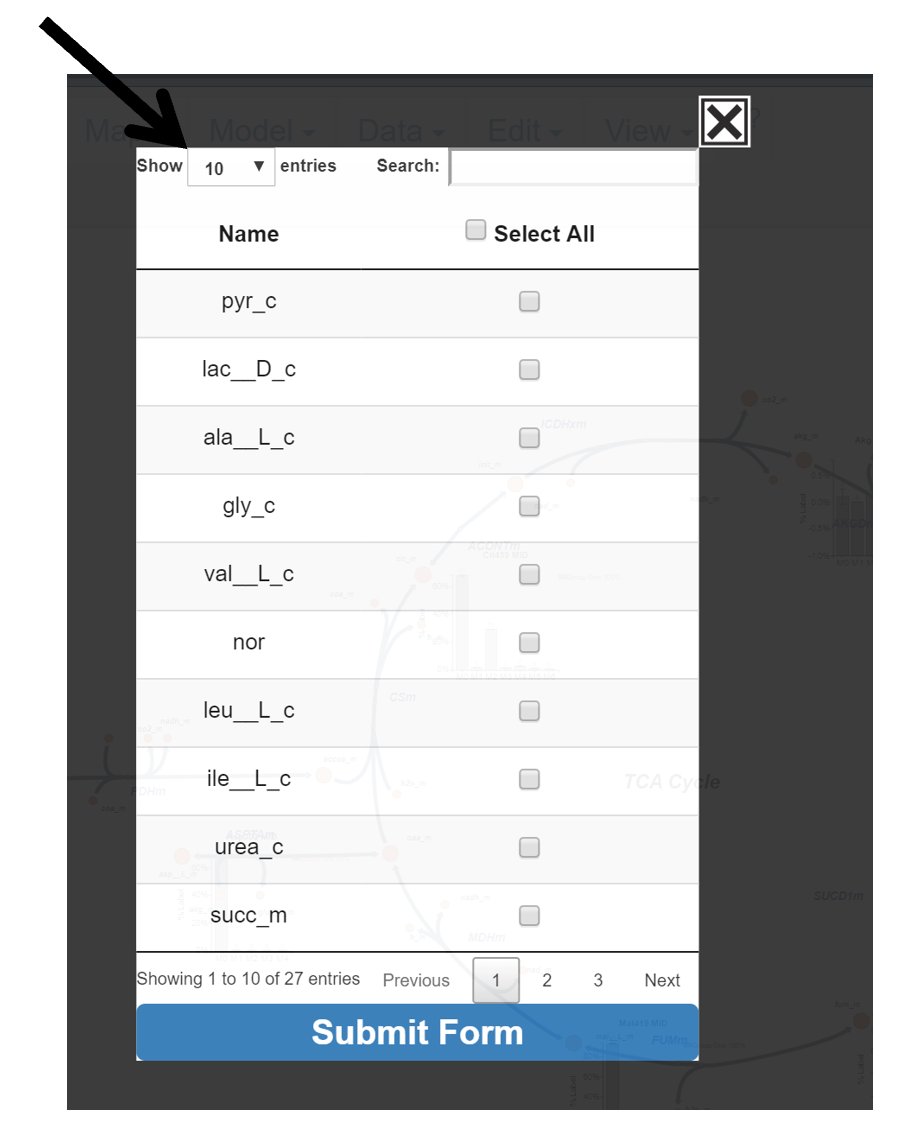
After Click:
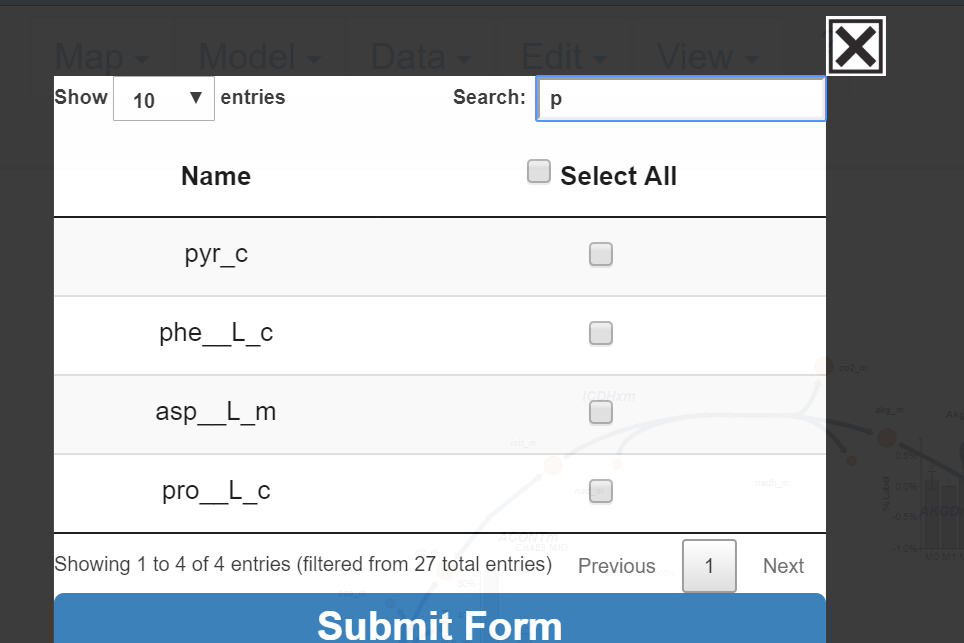
5.1.1.2 Search for Specific Metabolite
In the top right of the menu is a search bar. Click in the white box next to search and enter the name of the metabolite of interest. The table will automatically update search results with each entered character.
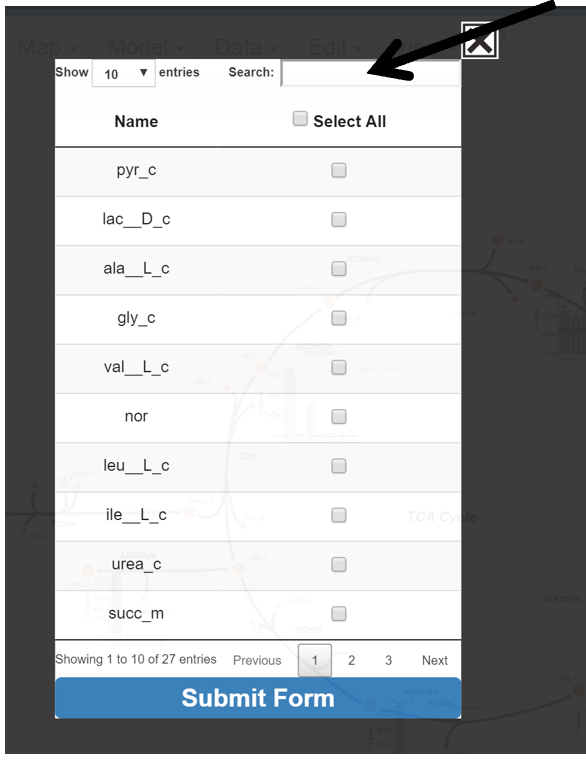
After First Letter Typed:
5.1.1.3 Select All
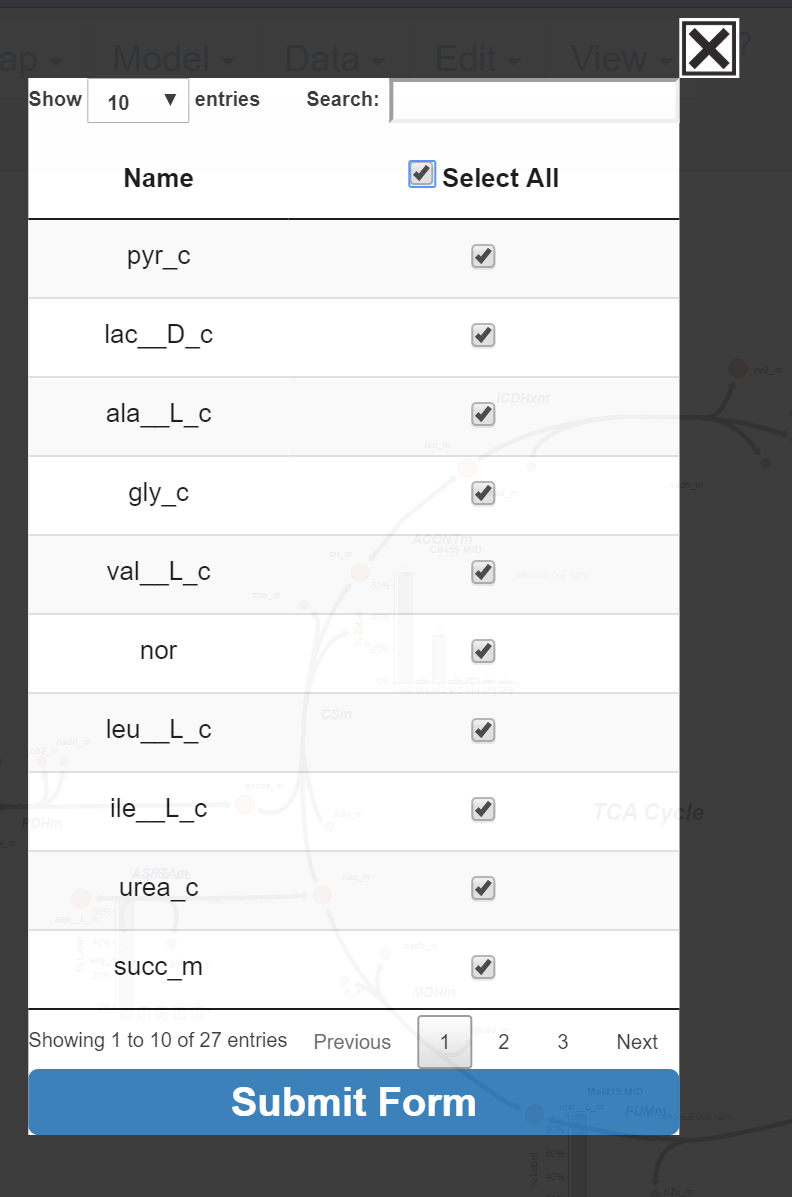
Click Select All to select all metabolites in the table.
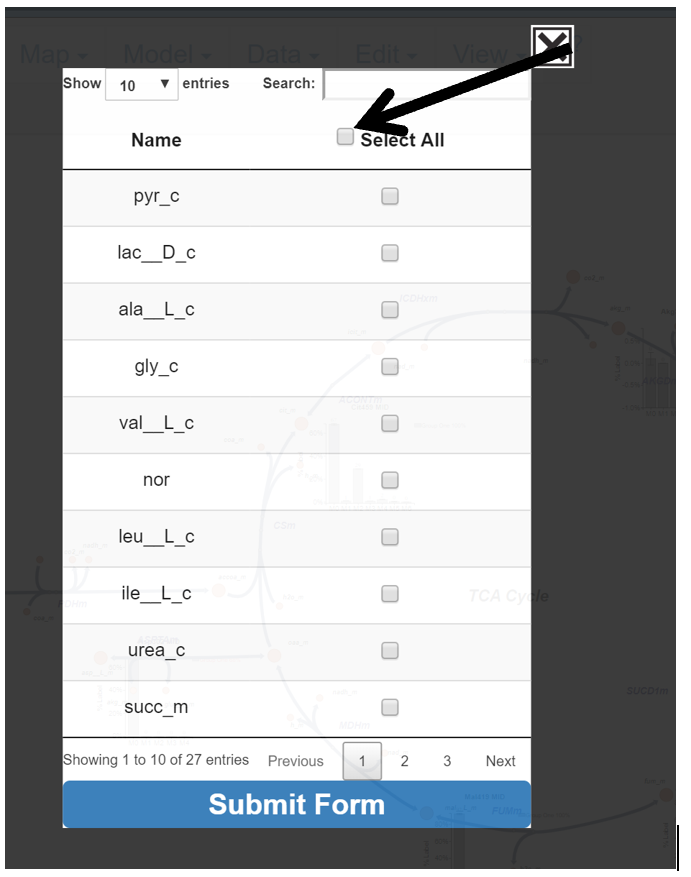
After Click:
5.1.1.4 Moving Pages
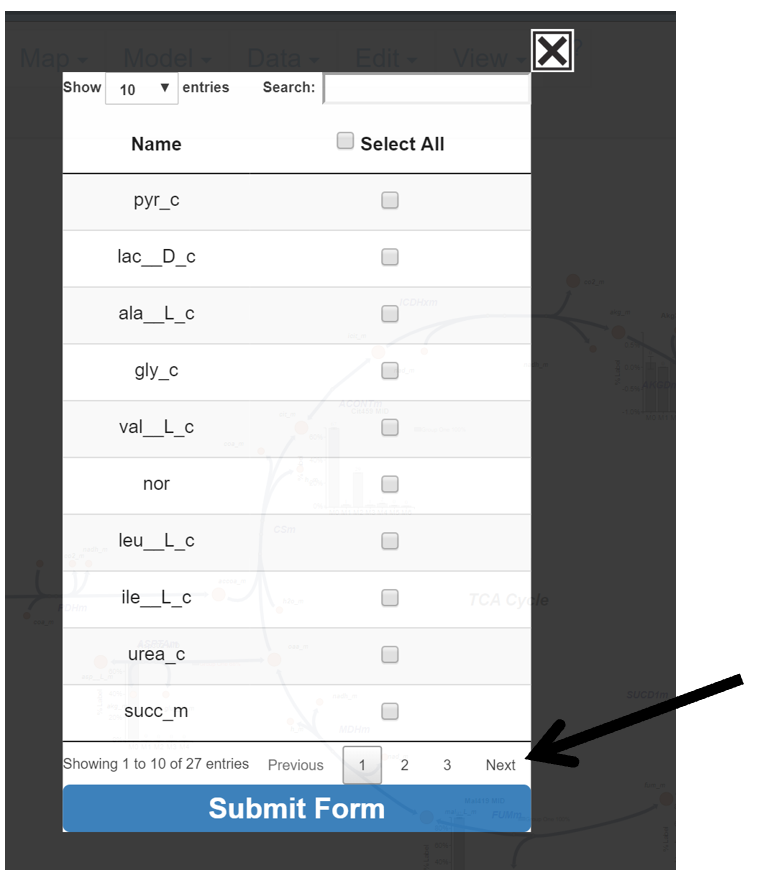
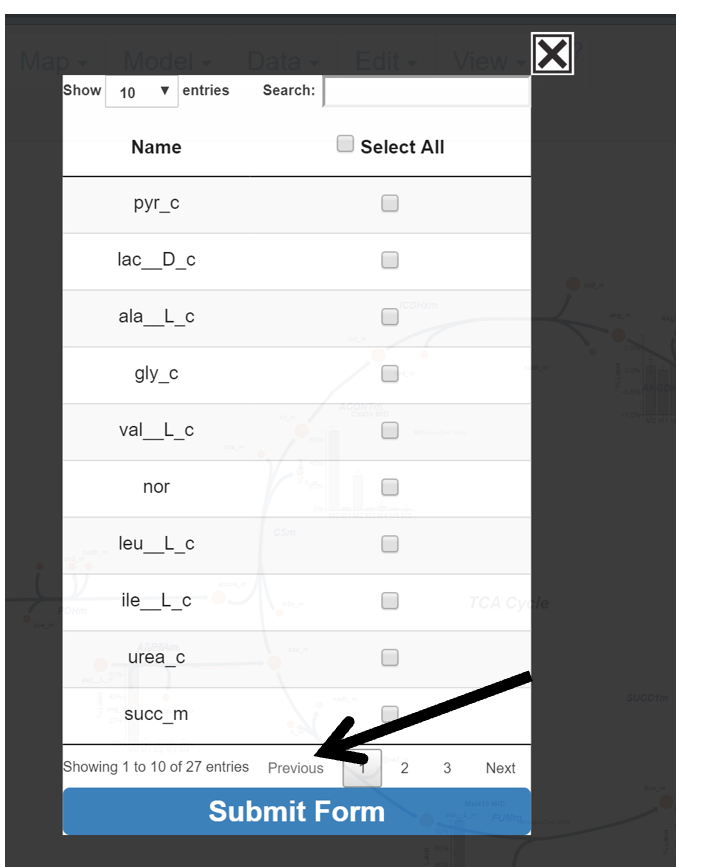
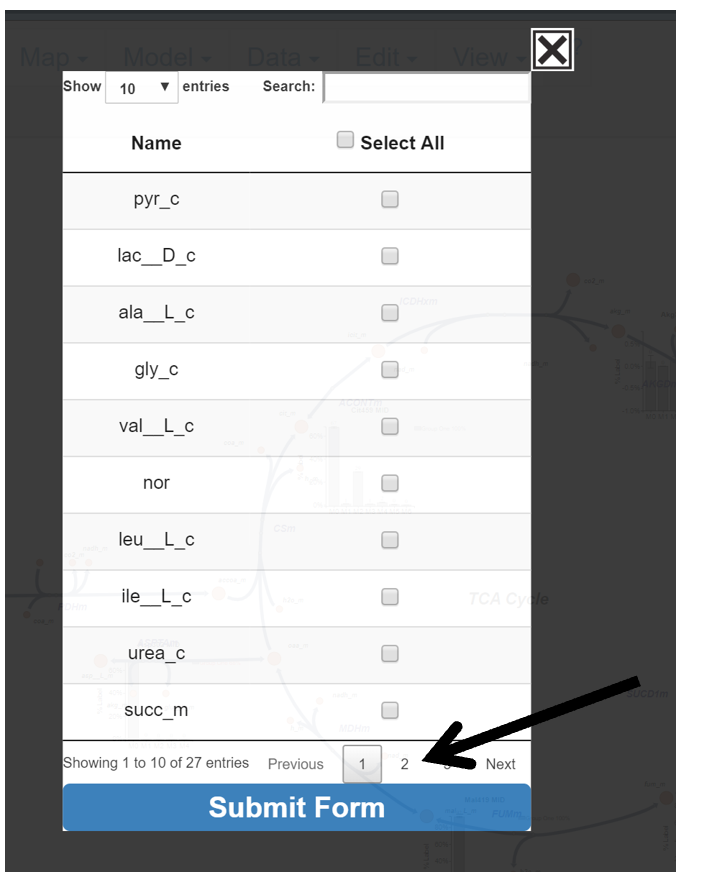
Move through pages by clicking Next, Previous, or the Page Number.
Next:
Previous:
Page Number:
5.1.1.5 Submit or Abort Changes
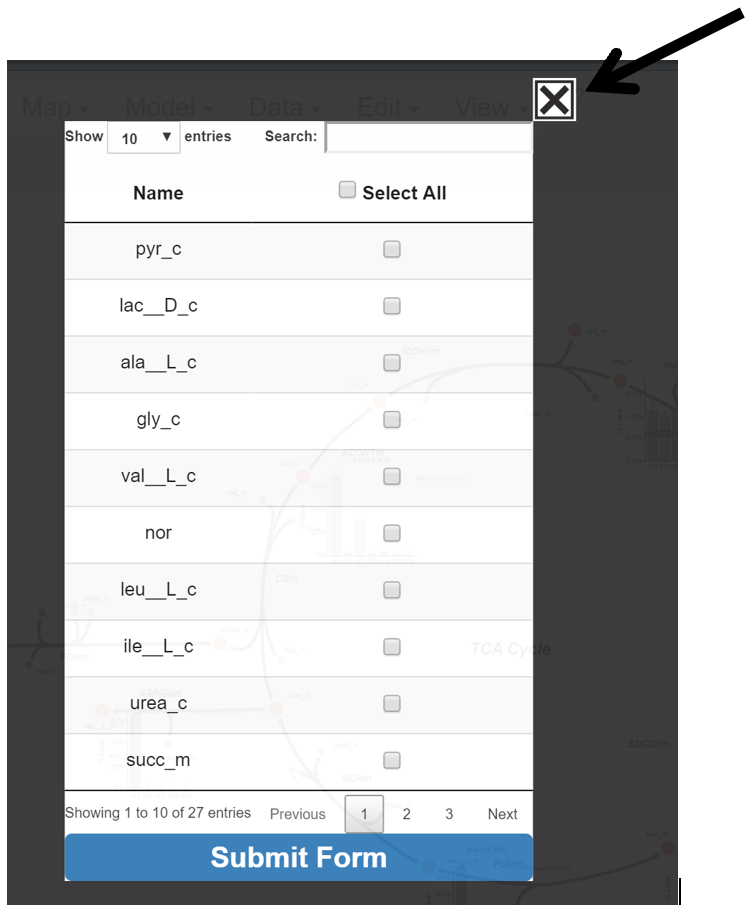
When finished with selections click Submit Form, to abandon changes click the X in the top right corner.
Submit Changes:
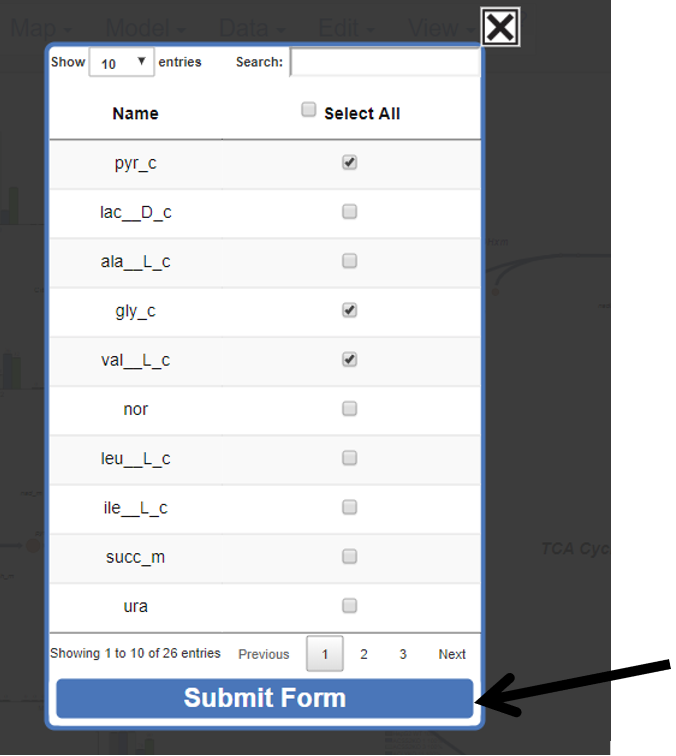
Before Submit:
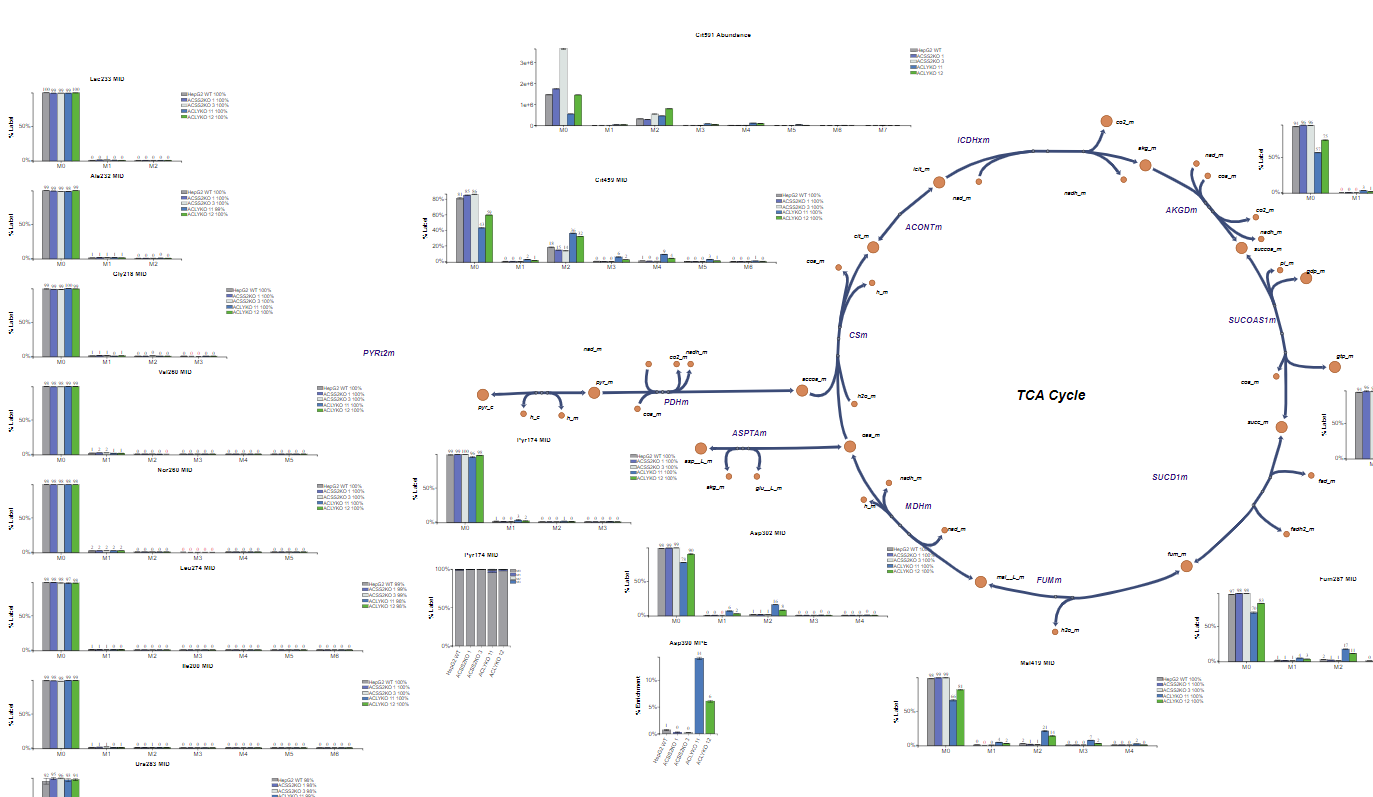
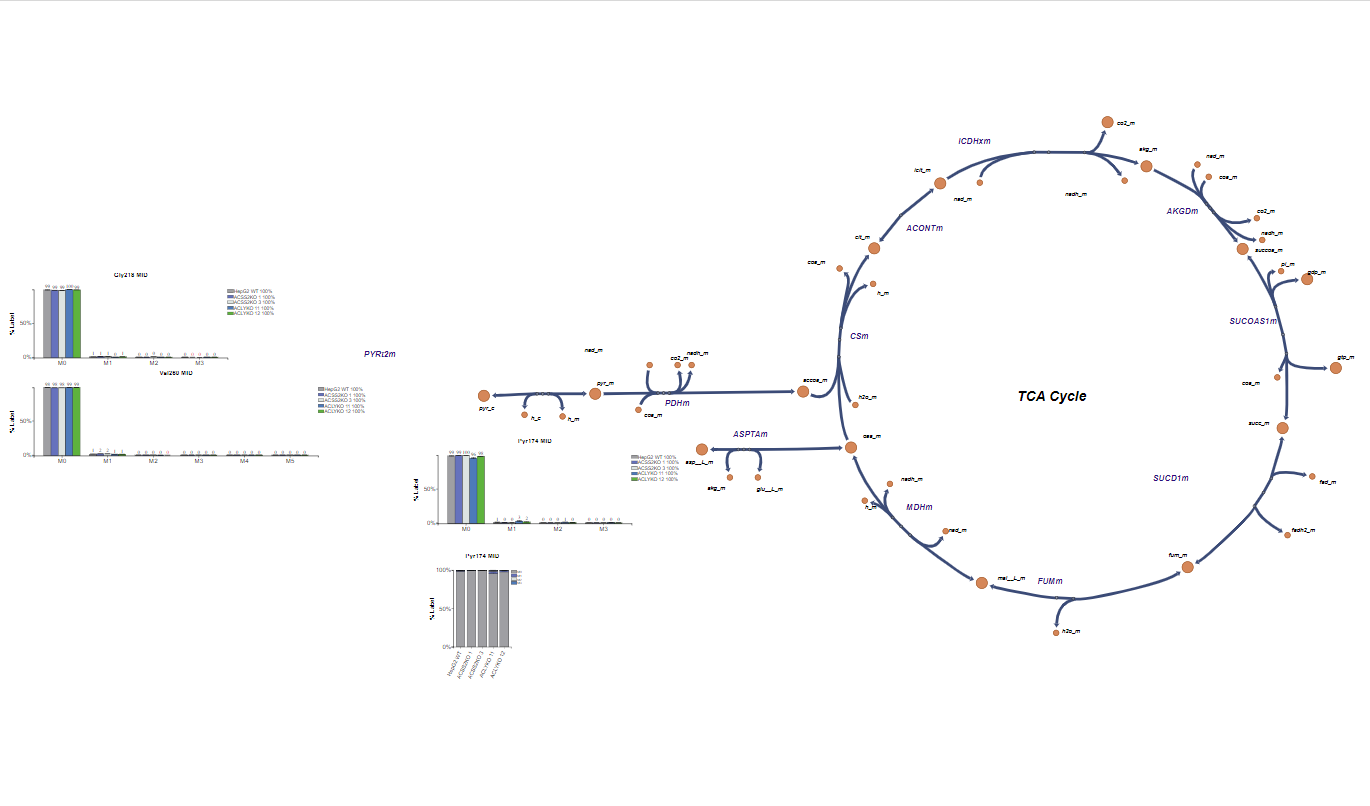
Only selected metabolites will be displayed on the Escher Map after submitting the table.
After Submit:
Abort Changes:
5.2 Isotopologues to Display
Escher-Trace allows the user to limit the range of isotopologues that are included in graphs generated for each metabolite/fragment. These entries are important for cleaning up data presentation in Escher-Trace graphs as well as critical for Mole Percent Enrichment calculations and graphs, as only isotopologues through the selected isotopologue are included in the enrichment calculation, more information can be found here. Below is a walkthrough of how to edit the isotopologue range of each metabolite/fragment in a dataset.
Click the Isotopologues to Display button to make the selection appear.
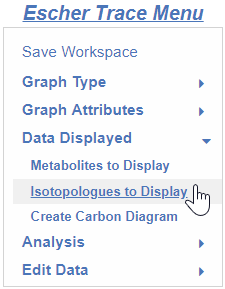
After Click:
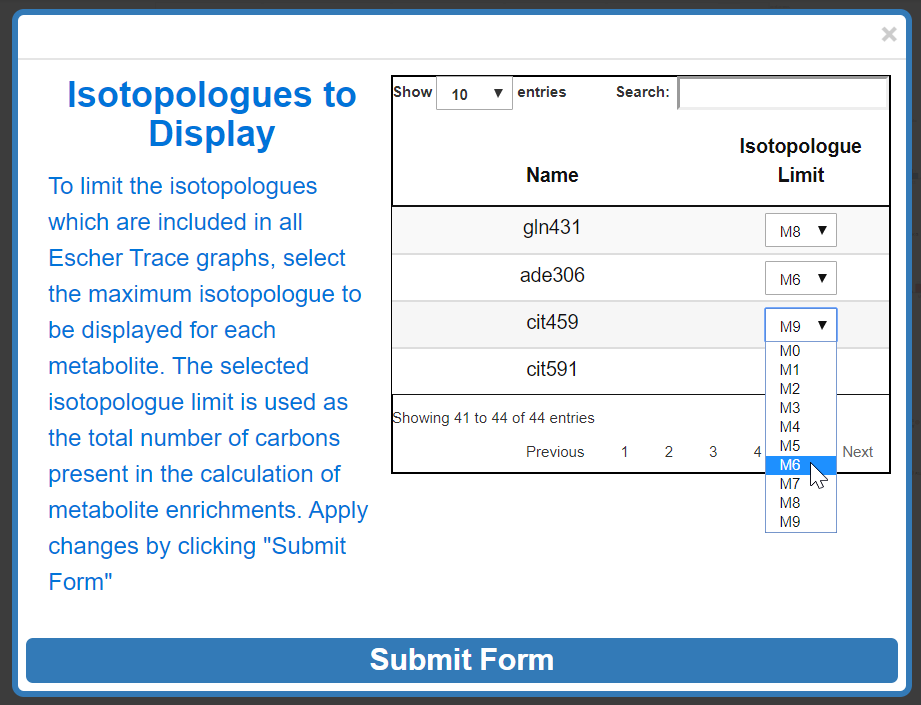
The majority of instructions for interacting with the Escher-Trace data tables can be found here. In the Isotopologues to Display data table, the user selects the isotopologue limit of a metabolite from the adjacent dropdown menu. Graphs of metabolites will display isotopologues from M0 to the user selected value.
To submit changes click Submit Form.
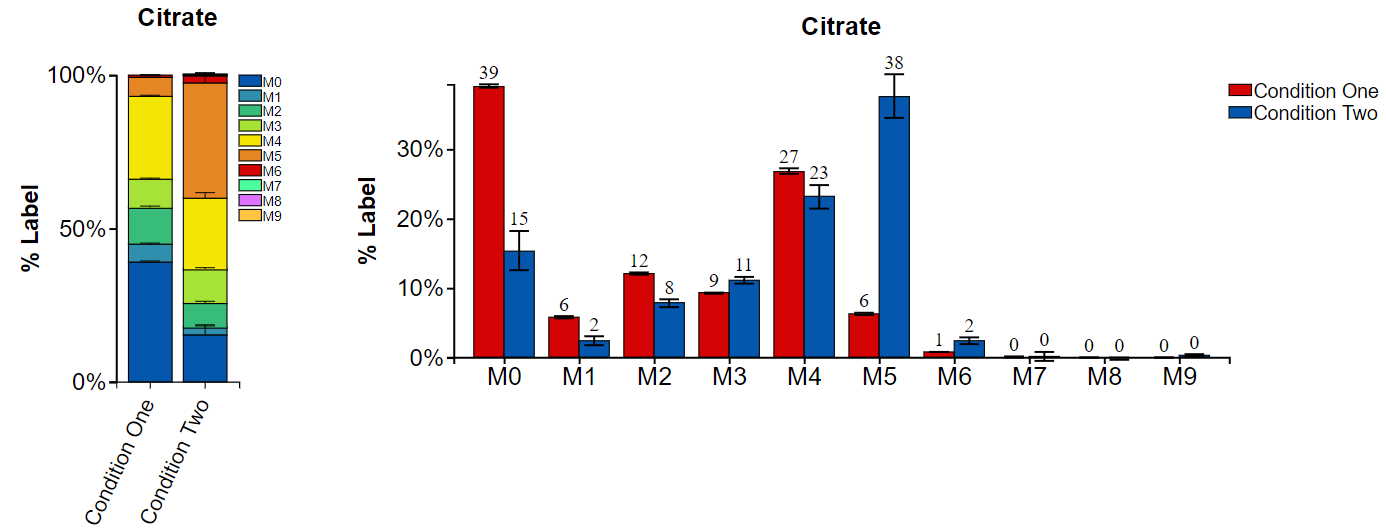
Before Submit:
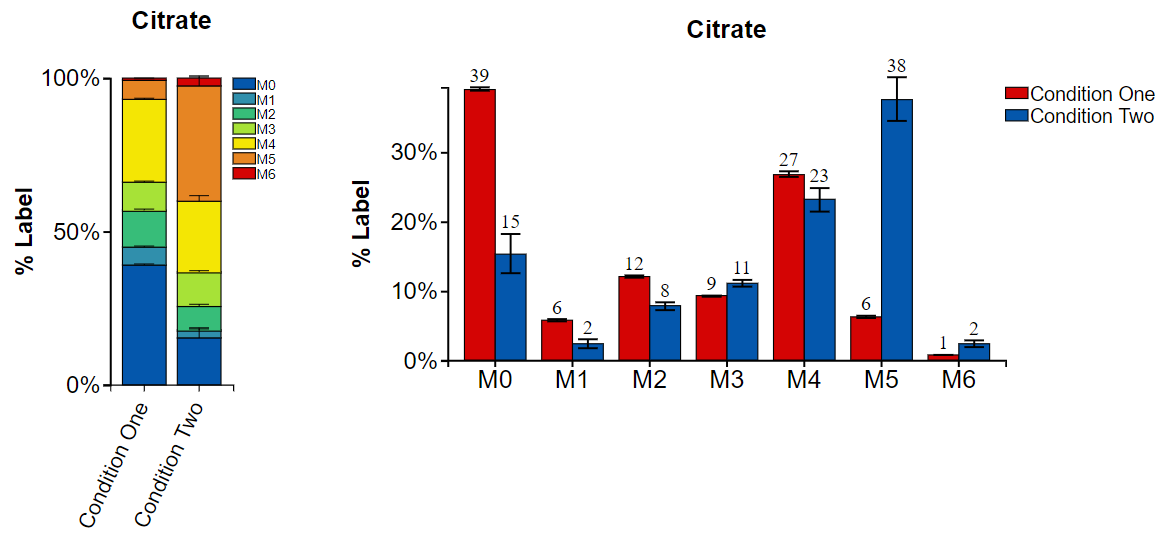
After Submit:
5.3 Create Carbon Diagram
Labeling diagrams are useful for depicting labeled vs unlabeled isotope positions in molecules. Below is a walkthrough of how to generate and use circle labeling diagrams in Escher-Trace. The circles in each diagram can be clicked to change their color indicating that the element is labeled or unlabeled.
5.3.0 Make the Create Carbon Diagram Pop-up Appear
Click the Create Carbon Diagram button to make the selection appear.
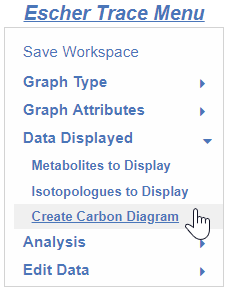
After click:
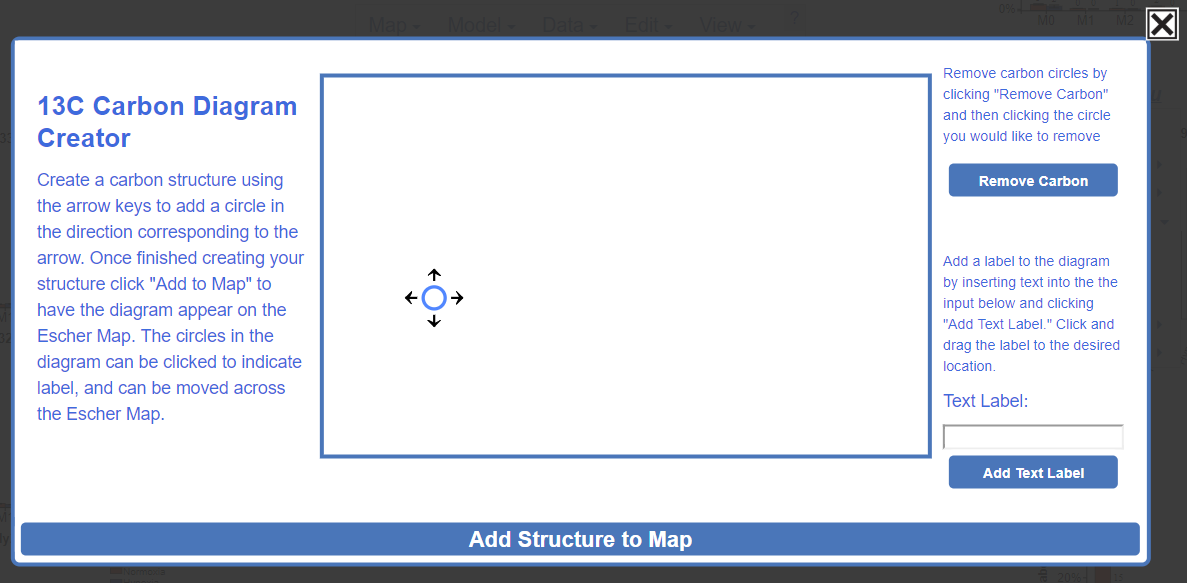
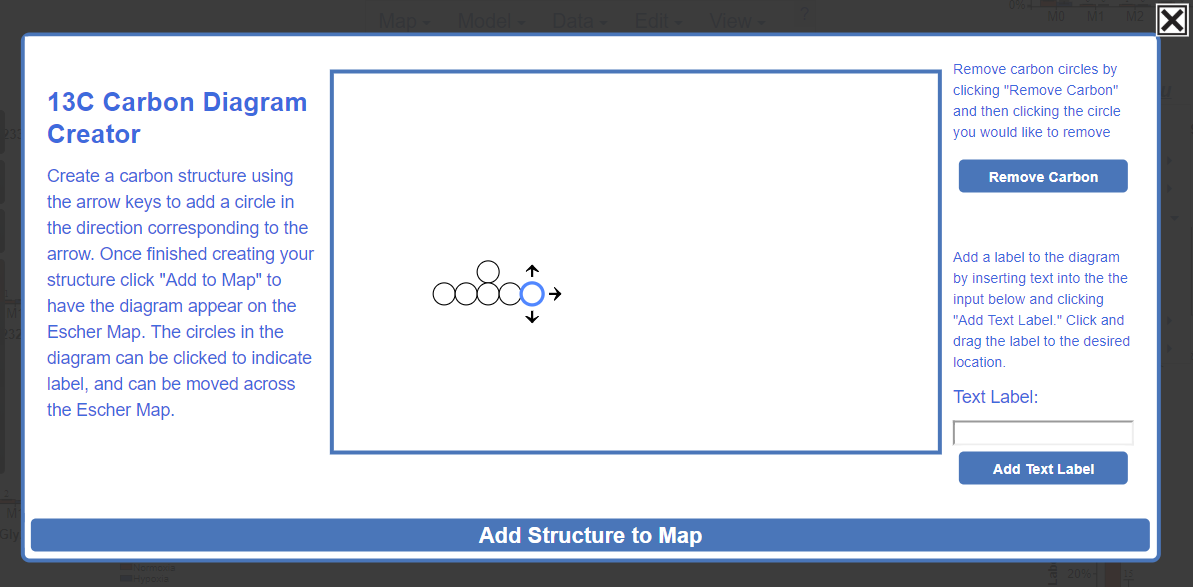
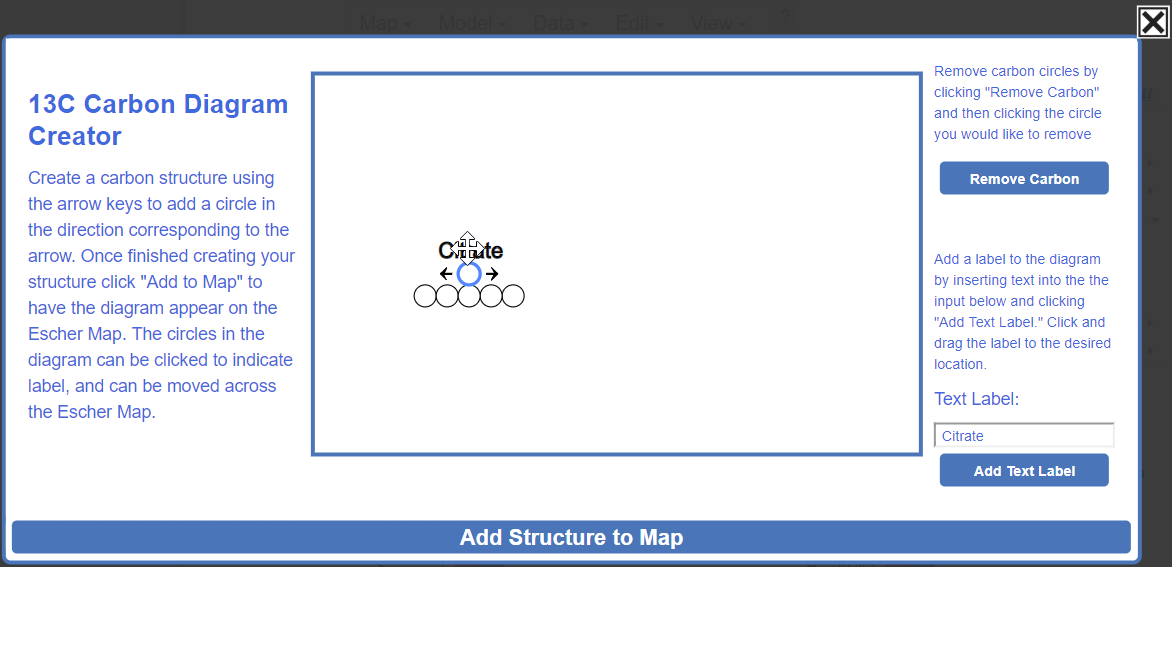
5.3.1 Building the Carbon Diagram
After the Create Carbon Diagram pop-up appears, the user may begin creating their carbon diagram using the arrow keys to add a circle in the direction corresponding to the arrow.
5.3.2 Removing Carbon Circles
To remove a circle from the diagram, first click Remove Carbon.
Hover over which circle you would like to remove. The circles will turn red as you hover over them.
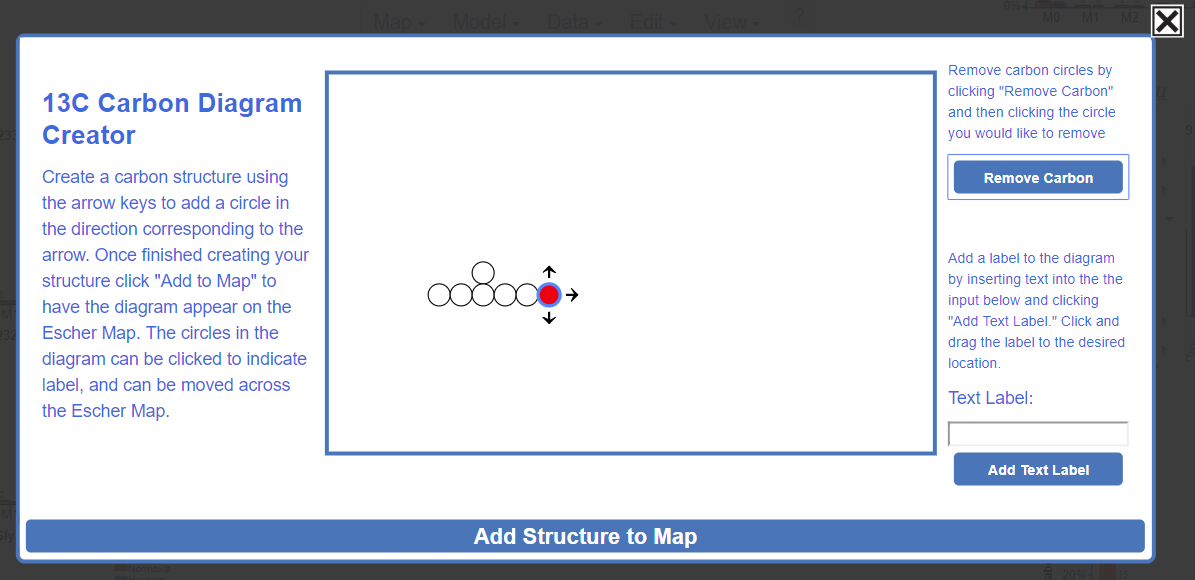
Click the red circle to remove it. All other circles positions will remain unaffected.
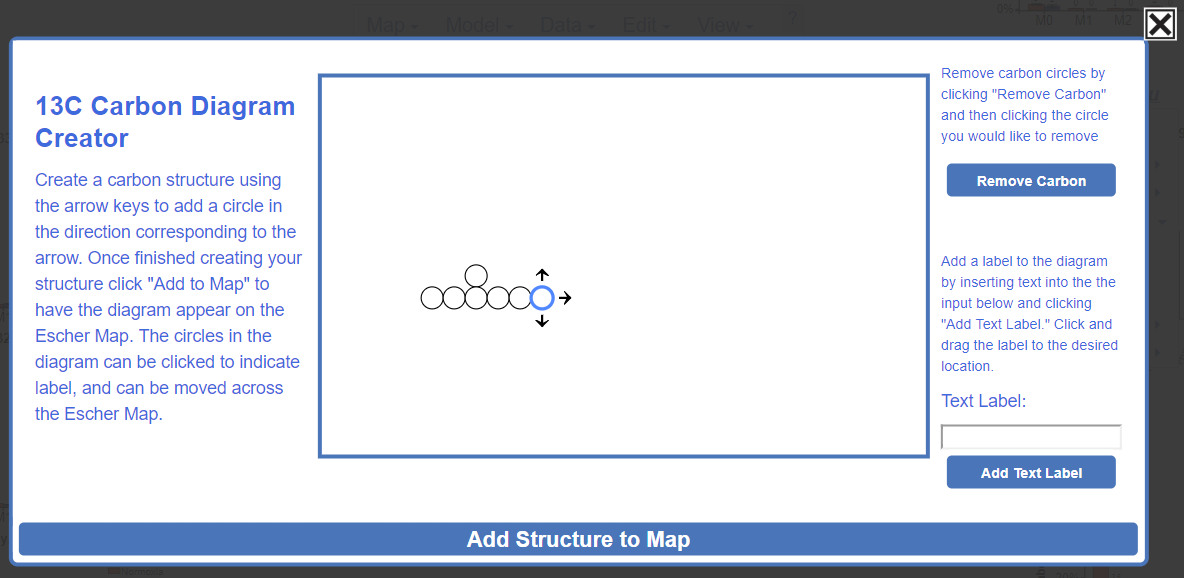
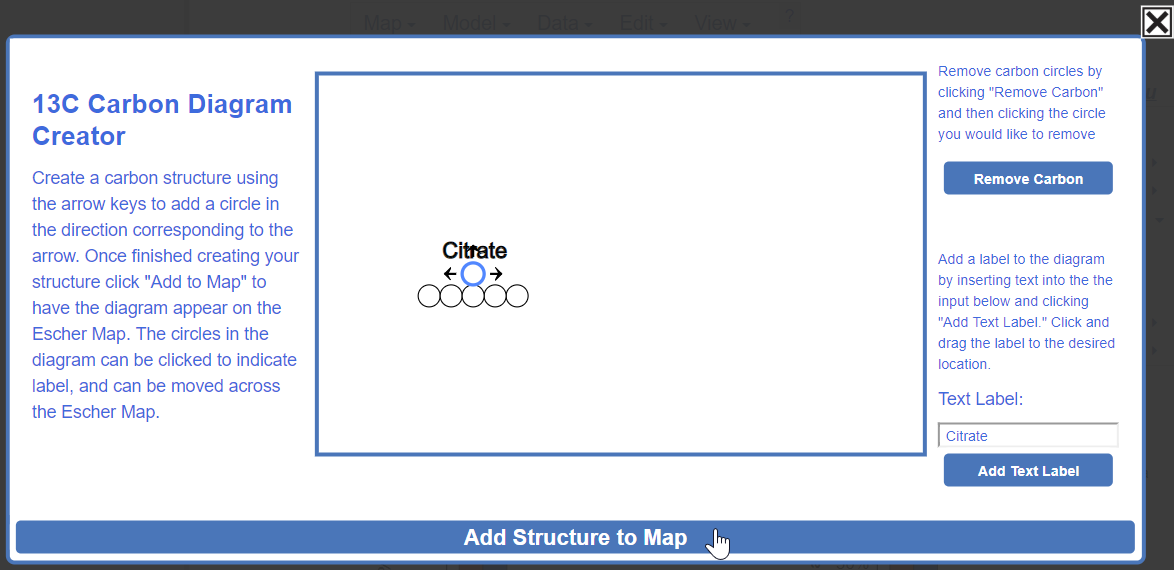
5.3.3 Adding Text Label
To add a text label to the diagram, enter the text you would like included in the label in the Text Label input.
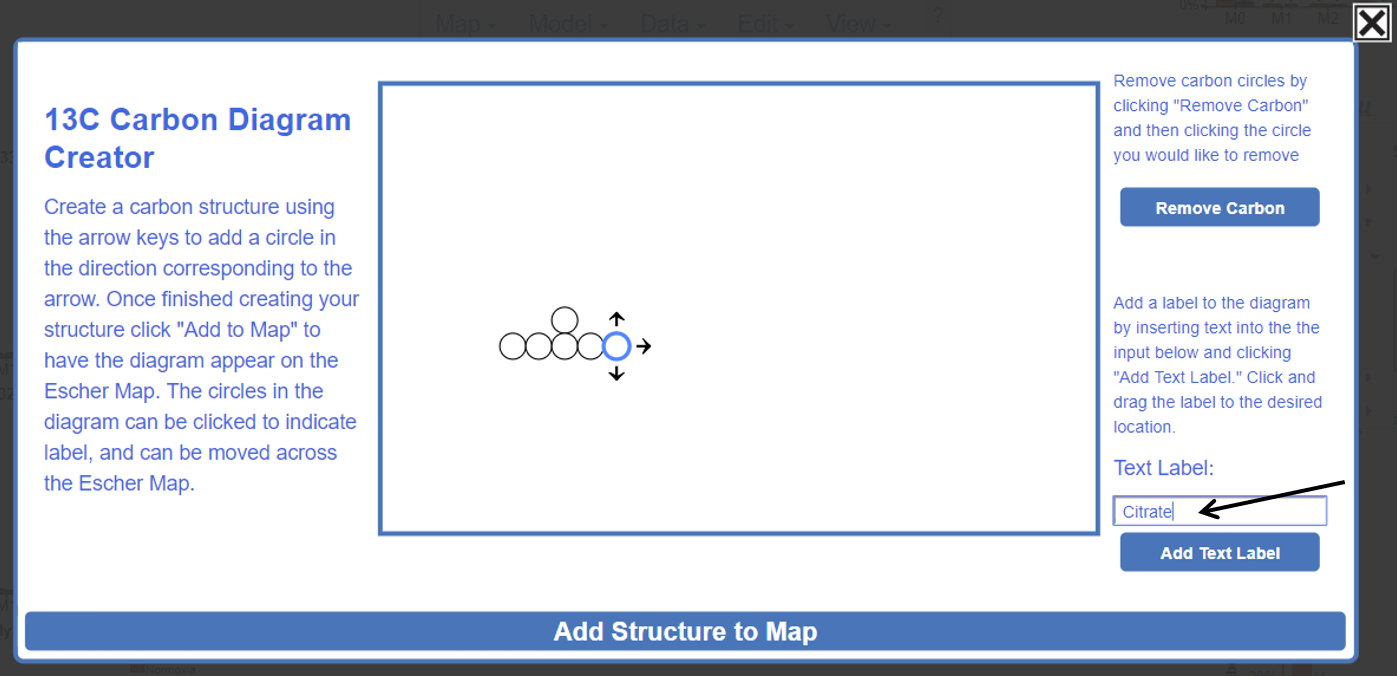
Click Add Text Label to have the label included in the diagram. The label can be updated by reentering text in the Text Label input and re-clicking Add Text Label.
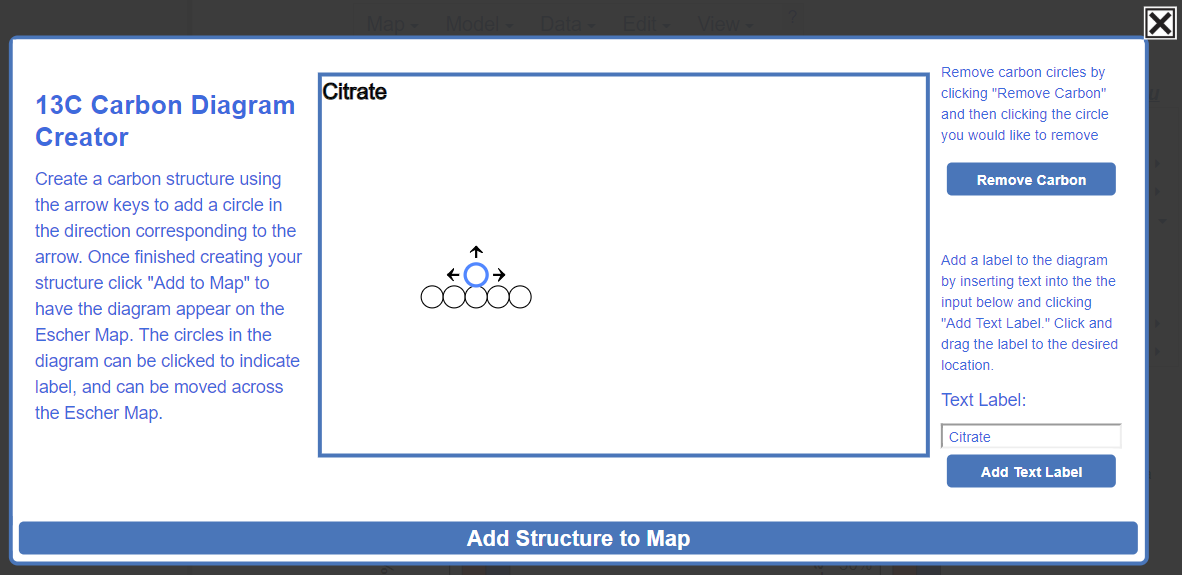
Click and drag the Text label to the desired location in the diagram.
5.3.4 Adding Carbon Diagram to Escher-Trace Workspace
Submit the Carbon diagram by clicking Add Structure to Map
After submission the diagram will appear in the top left corner of the Escher map:
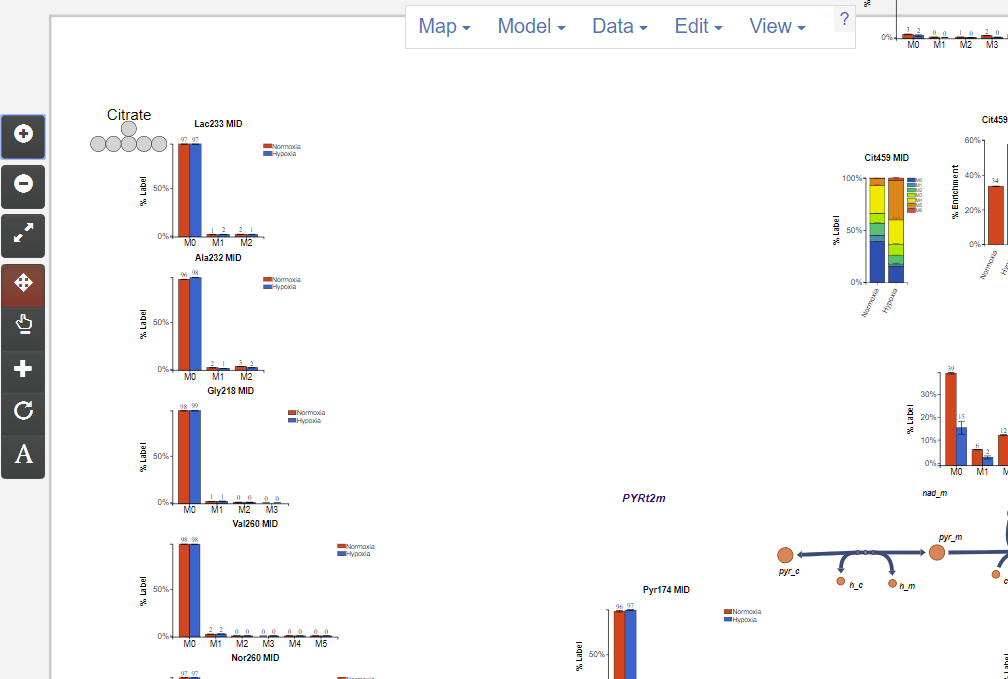
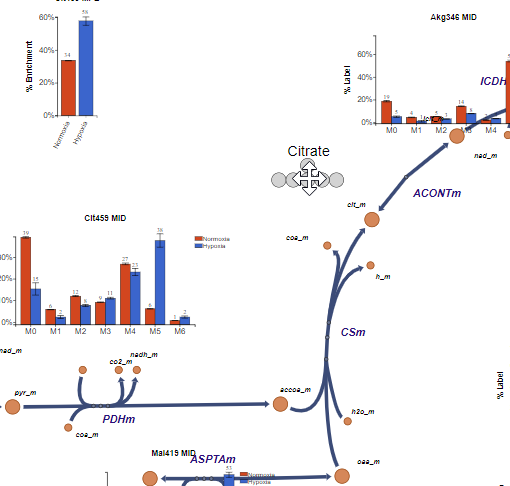
The diagram can be moved anywhere in the Escher map by clicking and dragging it:
5.3.5 Carbon Diagram Options
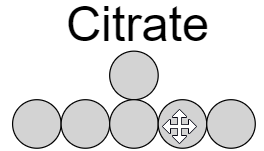
Individual circles in the diagram can be clicked to change their color.
Before left click:
After left click:
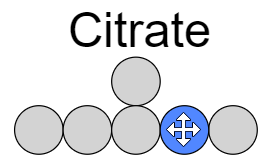
The circle can be clicked again to change the color back:
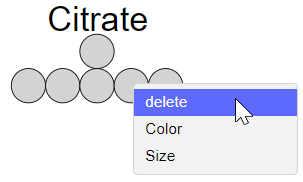
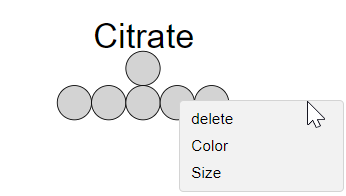
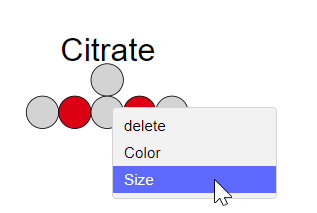
Carbon diagrams can be right clicked to access additional options in a dropdown menu:
5.3.5.1 Changing Carbon Diagram Color
To change the colors which indicate labeled and unlabeled carbons select Color in the dropdown menu.
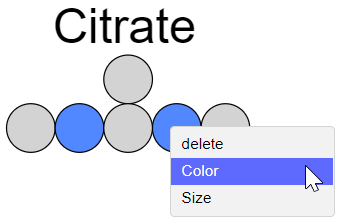
After click:
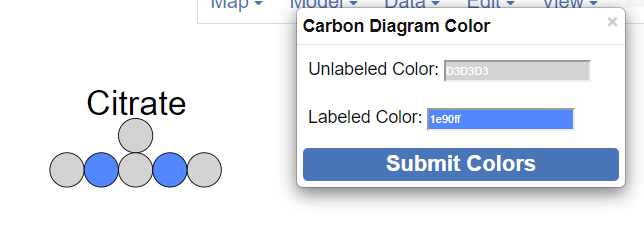
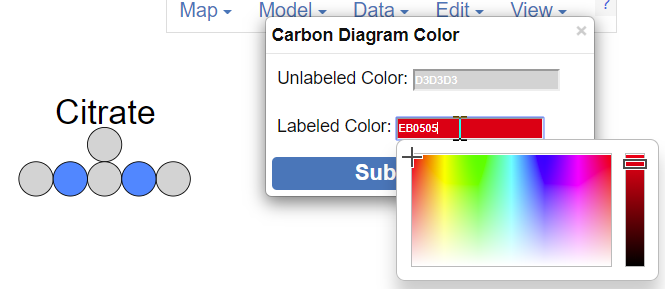
The colors indicating a labeled or unlabeled circles can be updated by entering a HEX code into the color inputs, or selecting the color from the color palette that appears when clicking on the color inputs.
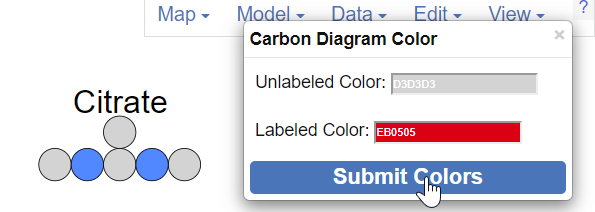
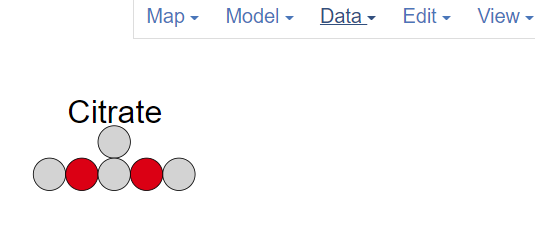
To submit the changes, click Submit Colors
After submission:
5.3.5.2 Changing Size of Carbon Diagram
To change the size of the carbon diagram select Size in the dropdown menu.
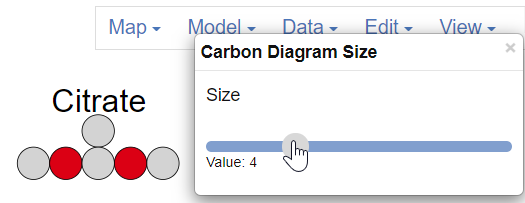
Change the diagram size by left clicking and dragging the gray circle slider underneath Size. Moving the slider to the right will make the diagram larger, moving left will make it smaller.
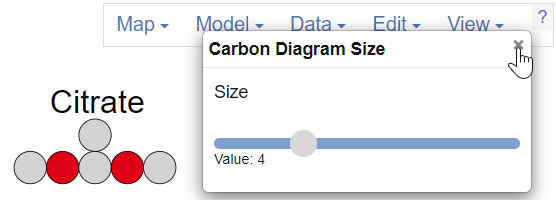
To close the Carbon Diagram Size popup, click the "x" in the top right corner of the popup.
5.3.5.3 Deleting Carbon Diagram
To delete a carbon diagram select "delete" in the dropdown menu.