Welcome to Escher-Trace
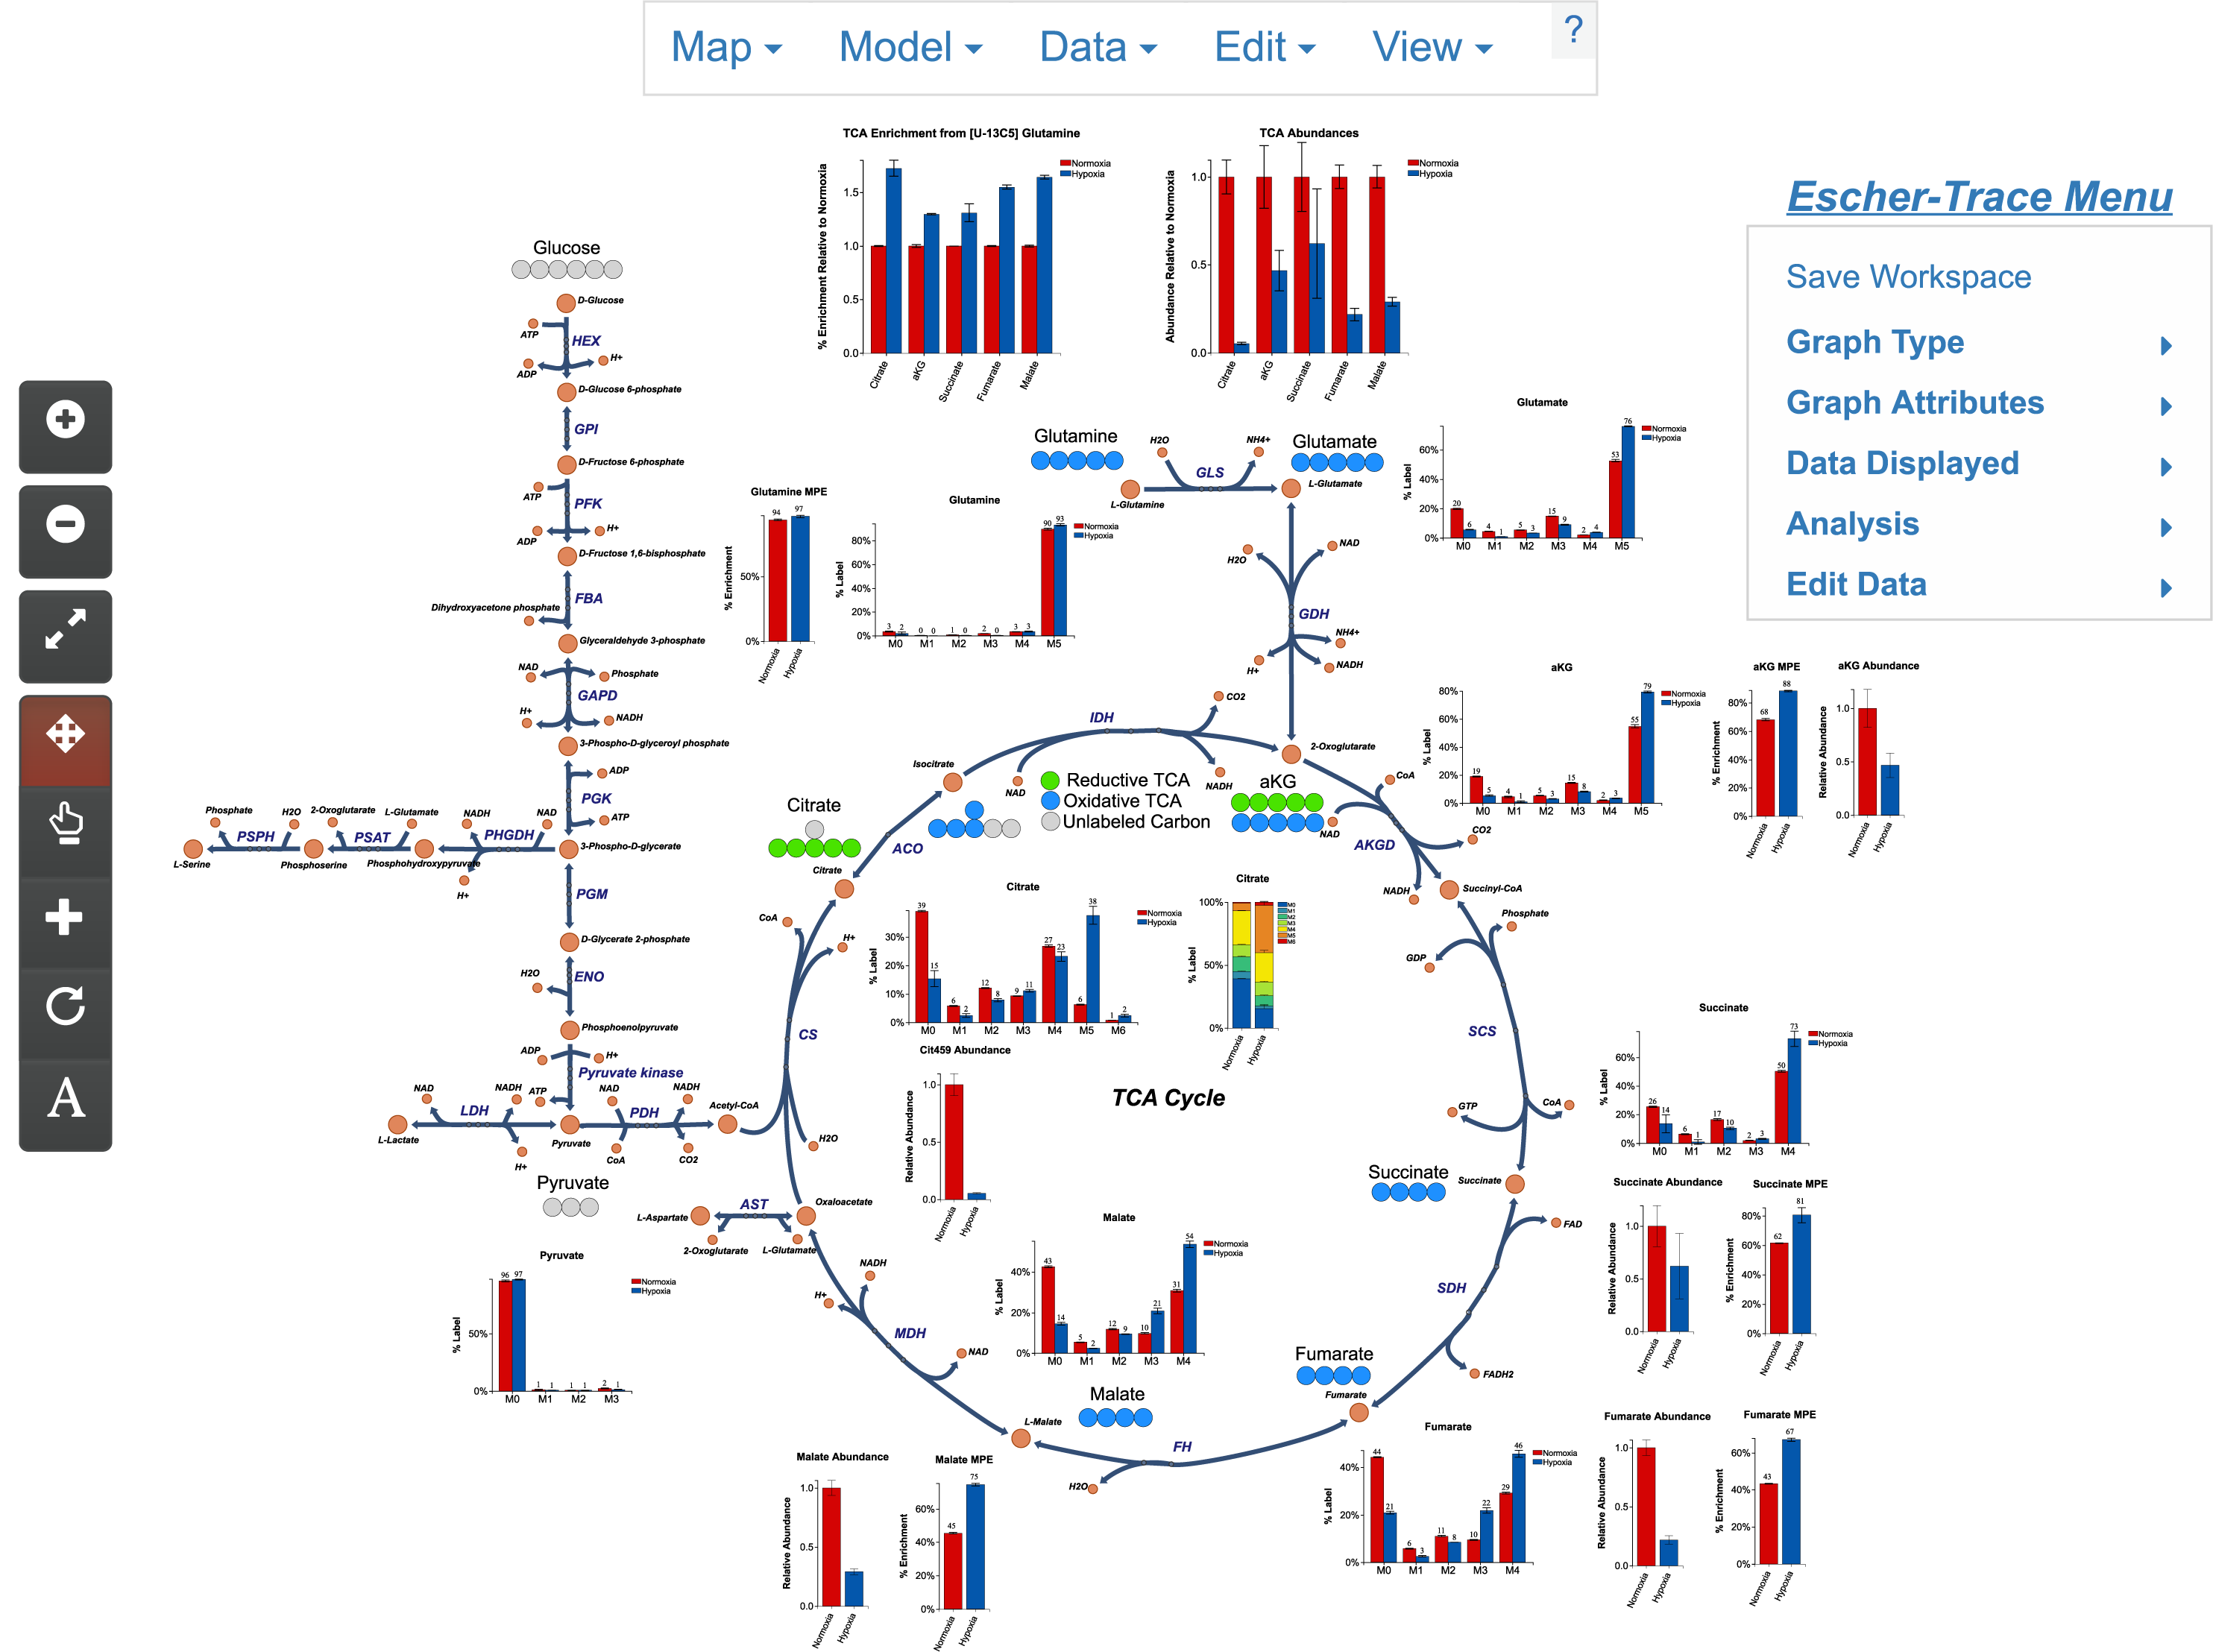
Escher-Trace is a tool for visualizing and analyzing stable isotope tracing data. You can find more information about how to use the tool by selecting from the menu options on the left. Escher-Trace is built on top of Escher. New users may be interested in the Getting Started with Escher-Trace guide.
Features
- Upload data in a simple JSON or CSV format
- Correct isotopic labeling for natural isotope abundance
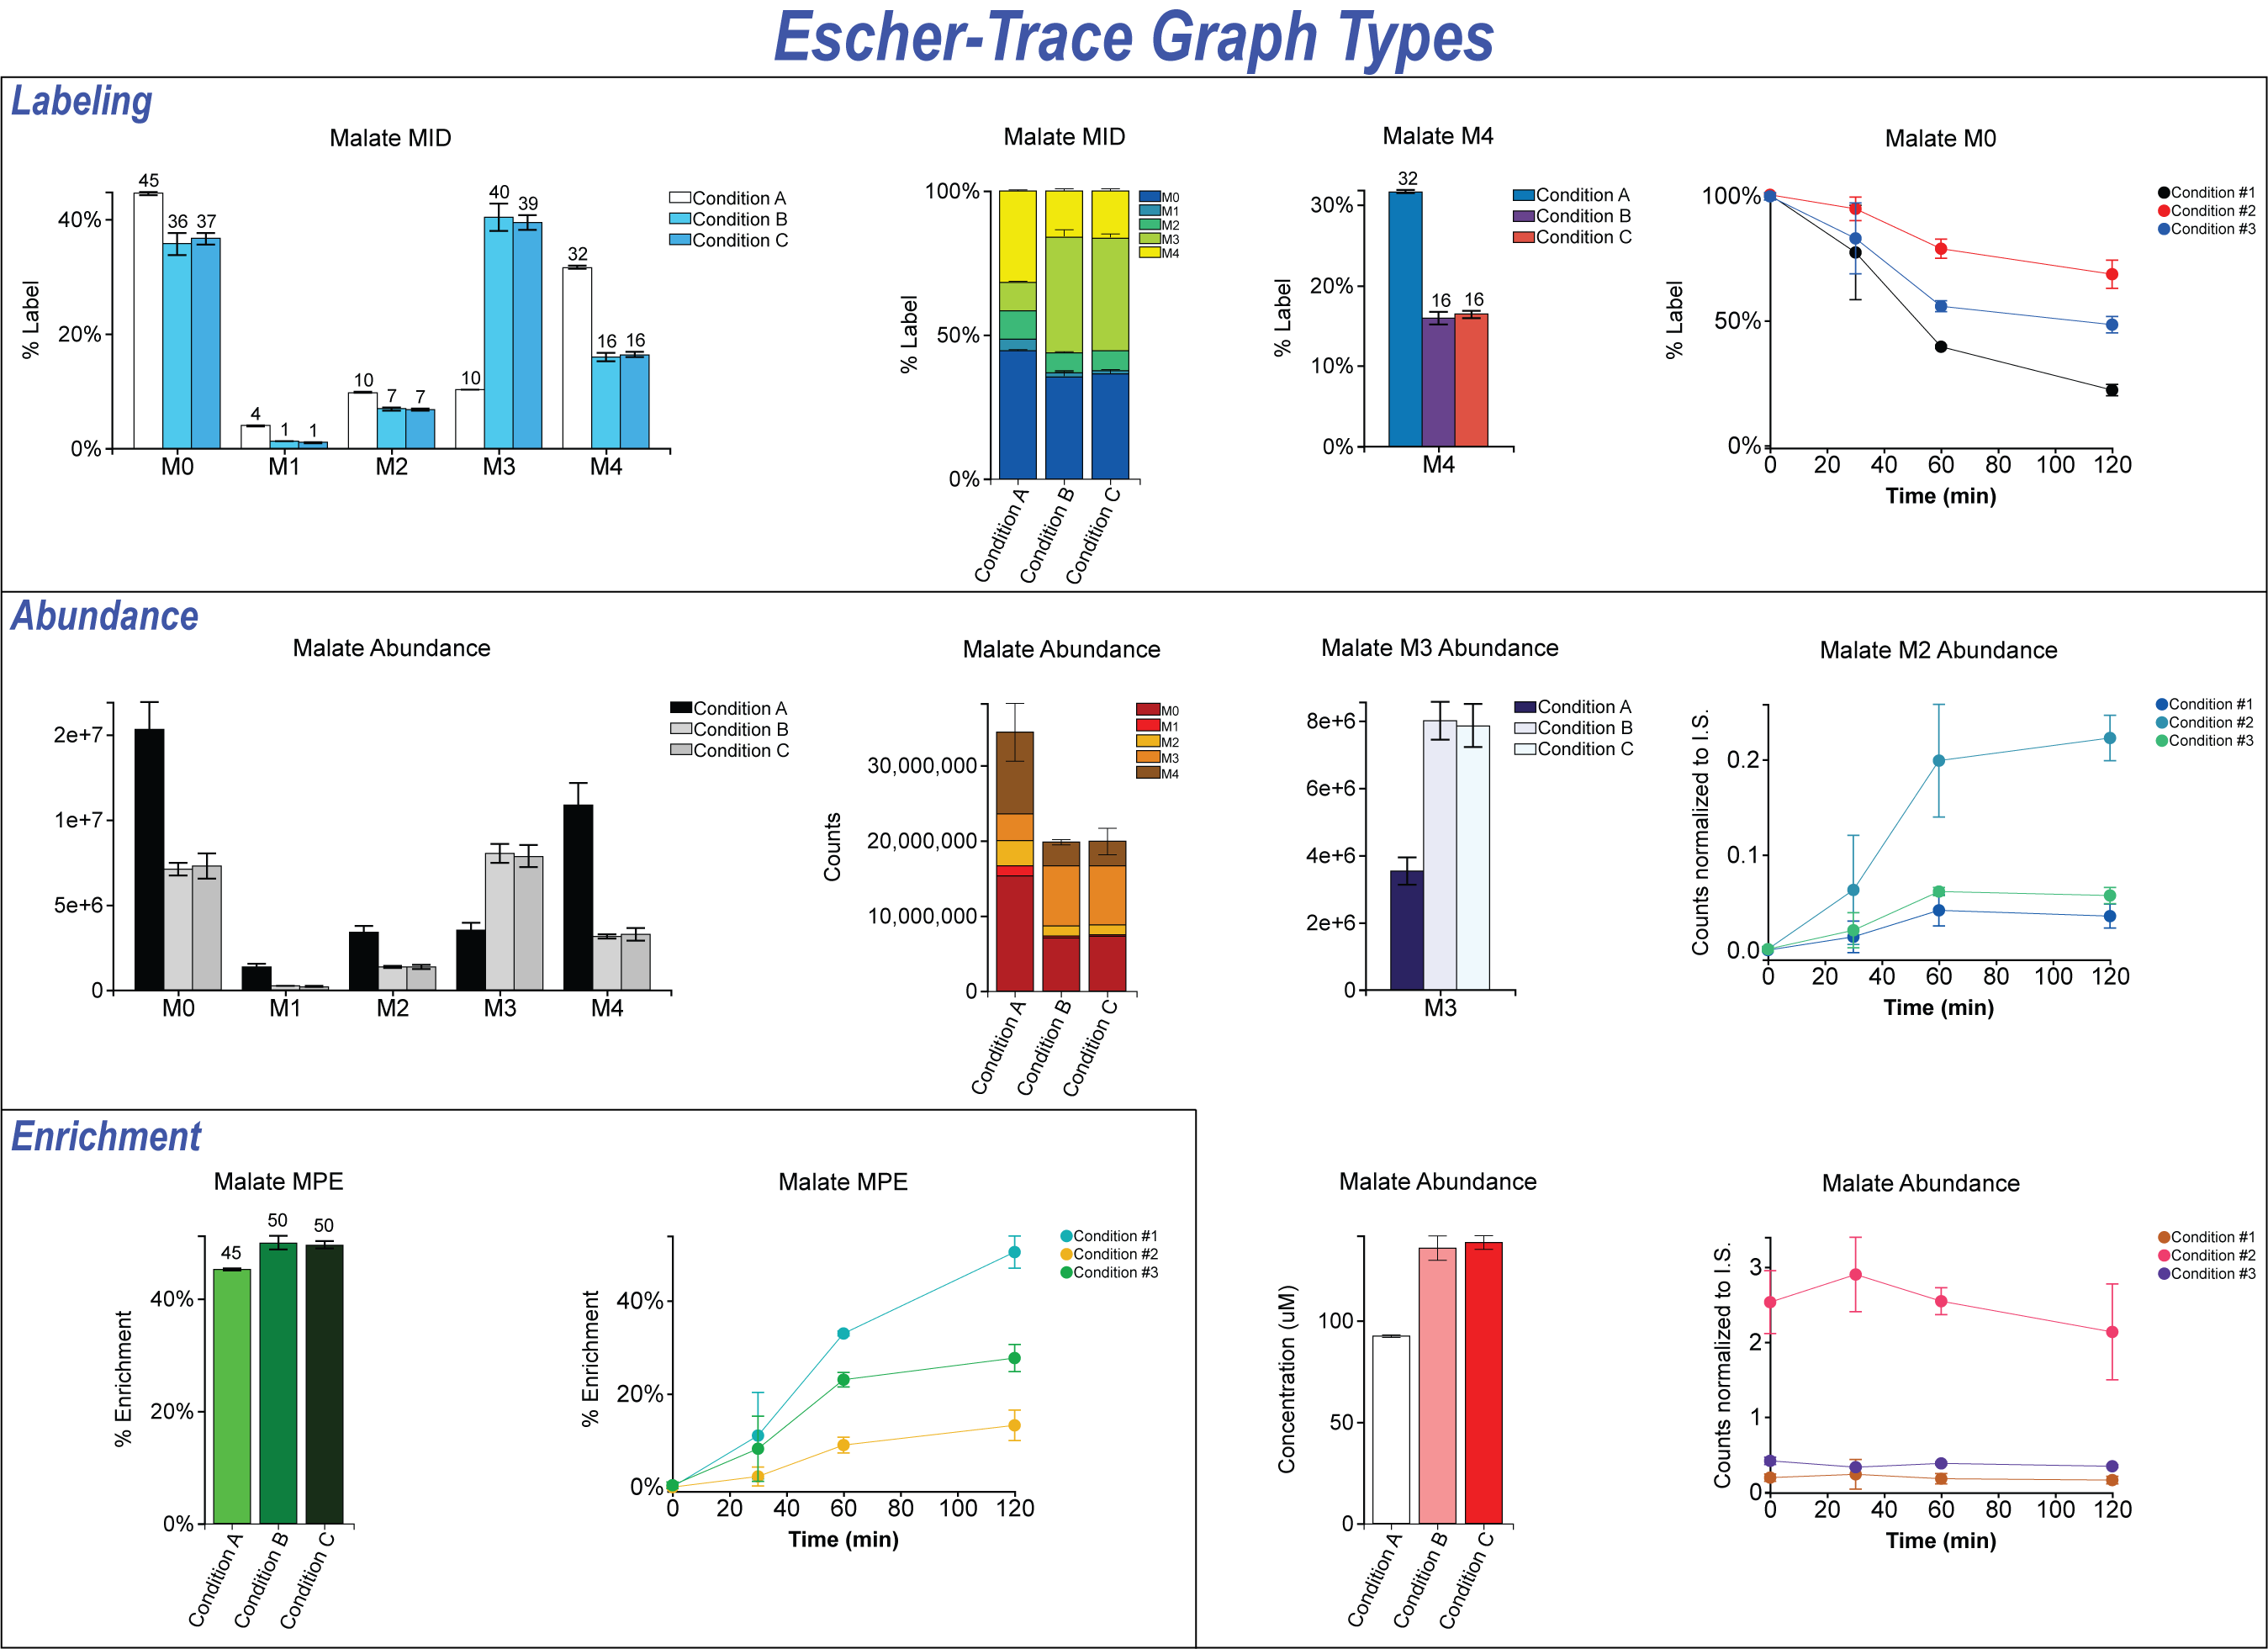
- Automatically generate publication quality graphs of:
- Mass isotopomer distribution
- Metabolite abundance
- Mole percent enrichment
- Kinetic labeling and abundance
- Export graphs in svg format, allowing for seamless integration with vector graphics editors (such as Adobe Illustrator).
- Full control over data normalization and sample/condition grouping
- Save and reload your workspace so you can start and stop analysis or easily transfer data to collaborators.
- Integration with Escher maps, allowing for simple loading and editing of pathway maps.
Supported browsers
We recommend using Google Chrome for the best user experience, however Escher-Trace will also run on Internet Explorer, Firefox, and Safari as well as mobile browsers.
Citing Escher-Trace
Avi Kumar, Jack Mitchener, Zachary A. King, and Christian M. Metallo. Escher-Trace: a web application for pathway-based visualization of stable isotope tracing data. BMC Bioinformatics 21, 297 (2020). https://doi.org/10.1186/s12859-020-03632-0
Questions?
Please contact us at eschertrace@gmail.com if you have any questions about Escher-Trace.